Hello, Empty Set
This is a placeholder article proving the pipeline end-to-end: R analysis → Cloud SQL → JSON/chart export → this Markdown file → commit → Cloudflare Pages deploy. Replace it with the real first article (Phase 2.2).
Embedding a chart
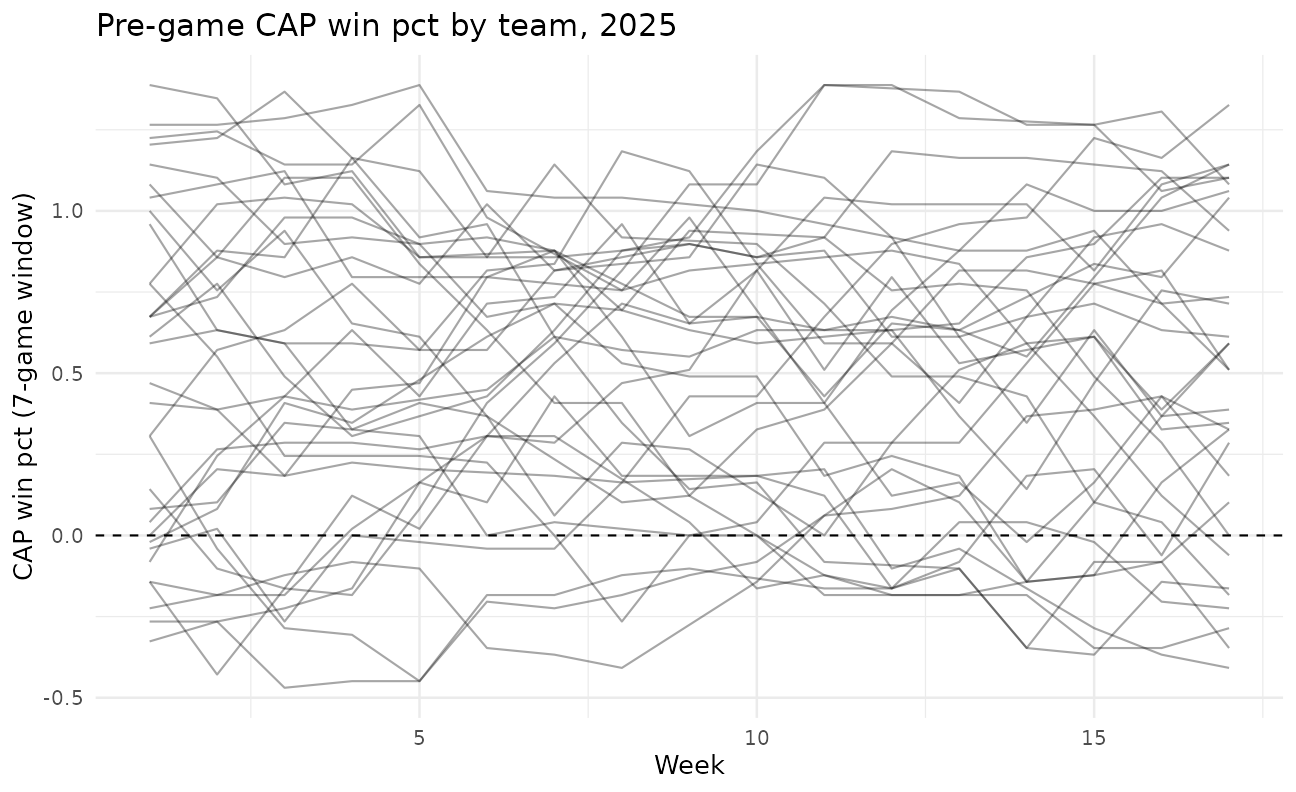
Charts exported by the pipeline land in public/charts/ and embed like so:
Embedding data
Data tables live on the data page, which reads the pipeline’s JSON exports at build time — no client-side fetching, no database on the site.